Immediately after an earthquake, critical decision-makers need to make many rapid choices about where resources should be deployed. The EQ visualiser gives an instant, graphical overview of which areas are likely to be the hardest hit.
How the visualiser works
Ground force acceleration (GFA) measures how intensely the earth shakes at a specific location during an earthquake. GFA depends not just on the magnitude of the quake, but on its depth and duration, the length of the faultline, the distance from the epicentre, and local geology, so different locations will experience different GFAs during the same quake.
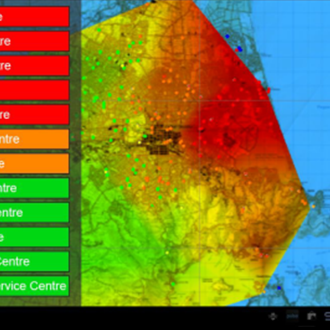
We’re all used to seeing quake magnitude data on maps, but the EQ visualiser software is the first to show GFA data graphically. It uses a colour-coded overlay on a map, ranging from red for the highest GFA, to green for the lowest. This “heat map” lets you see at a glance what areas of the city have experienced the most intense shaking, and are likely to be the most affected.
The visualiser uses GFA data from seismic sensors called accelerometers. The Christchurch City Council has partnered with local seismic instrument manufacturer CSI to install 150 accelerometers on key Council buildings. These sensors supplement GeoNet’s existing network of instruments, providing detailed ground force acceleration data for the entire city. Christchurch City Council will use the EQ visualiser after significant earthquakes to prioritise inspections of its 1200 buildings, trigger decisions on precautionary evacuations, and to assess which areas are likely to need assistance most urgently.
Expected outcomes and benefits
- Graphical display makes it easy for anyone to interpret seismic data without technical knowledge
- Provides a more accurate view of an earthquake’s effects than predictions based on magnitude
- Allows likely levels of damage to be gauged without having to visit every location
- Aids assessment of remote communities, and places that the quake has rendered physically inaccessible
- Response can be prioritised more effectively, and assistance delivered to the right places more quickly
- Data-based decision-making will be more robust and reliable
- The public and media can use the map to gain a clear understanding of the impact of a quake
- Helps to prioritise inspections of Council’s 1200 buildings, and provides indicative information for other building owners
What’s next?
The initial sensor rollout in 2017 installed 150 accelerometers on Council buildings. GeoNet plans to add more sensors throughout Christchurch/the country. A map layer will be added to the SmartView web application to show data from the EQ visualiser software.
How EQRV works
The programme will provide an engaging and easily understandable visualisation of the ground force acceleration of a seismic event that will enable:
- near real-time building assessment information for Council facilities (enabling prioritisation of inspections)
- visualisation on the Christchurch SmartView platform for public viewing, as well as providing indicative information for building owners who don’t have permanent monitoring solutions and/or rapid access to engineers.